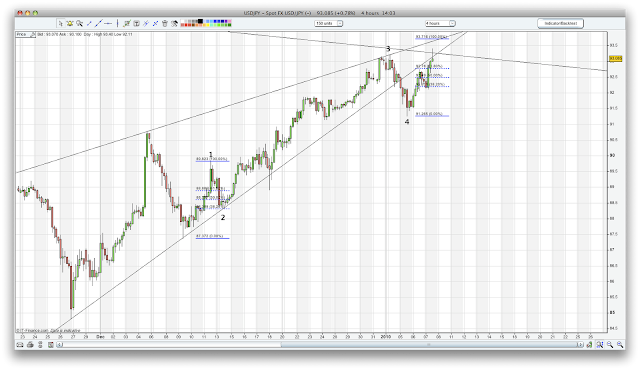
Above is a 4 Hour Chart of the USD/JPY pair. 4 waves up can clearly be seen, however wave 4 may or may not yet be complete. If wave 4 is complete, wave 5 will be equal to wave 1 at around 93.70. Below is the same chart but with wave 4 drawn in as an irregular flat. This is what I believe to be the more likely scenario at present due to the look of the recent price action on the hourly (see bottom chart) which looks likely to complete as a 3 wave move. Wave a of B will be equal to wave c of B at 93.60. Whichever scenario plays out, I believe selling this pair at around that region should be profitable. Keeps stops above 94 and move them to break even when price has fallen back to 93.
Friday, January 8, 2010
Subscribe to:
Post Comments (Atom)


No comments:
Post a Comment